
First Quarter 2024 - The AI Boom Shifts Into High Gear In Q1 Pushing North American Markets to All-Time Highs
Aye yAI yAI!
Artificial intelligence (AI) stocks have put the markets on their backs so far in 2024. The more notable AI stocks – Nvidia (NVDA) and Super Micro Computer (SMCI) – were up 82% and 255% respectively in the first quarter, with the latter going from a nearly unknown stock to being included in the S&P 500 in a matter of months. The strong quarterly performance reflected a continuation of the AI trend which began in late 2022 following OpenAI’s unveiling of Chat-GPT 3.5.
Nvidia controls roughly 80% of the high-end AI chip market while Super Micro designs and builds AI servers for its customers. Both are well suited to benefit from the increase in AI related spending. Nvidia and Super Micro are two the biggest beneficiaries of the AI boom, with quarterly revenues rising ~265% and ~100% over the past year, partly justifying the stocks’ price moves we’ve seen over the past year. Many other stocks that have been lumped into the AI stock bucket – Palantir (PLTR), C3.ai (AI), Marvell Technology (MRVL) – to name a few, have not seen revenues grow in such an impressive way and yet their stocks have jumped on investors’ AI enthusiasm. These stocks look a bit more vulnerable to downside as the hype doesn’t seem to match their economic reality.
Booms of Yore and What They Tell Us
Speculative booms like these are part of our human nature and have occurred since the dawn of time. Oftentimes, by the time the boom becomes apparent, it is already too late for things to work out well for new buyers, at least in the short-to-medium term. The hype around booms like these is often justified but the valuations often are not.
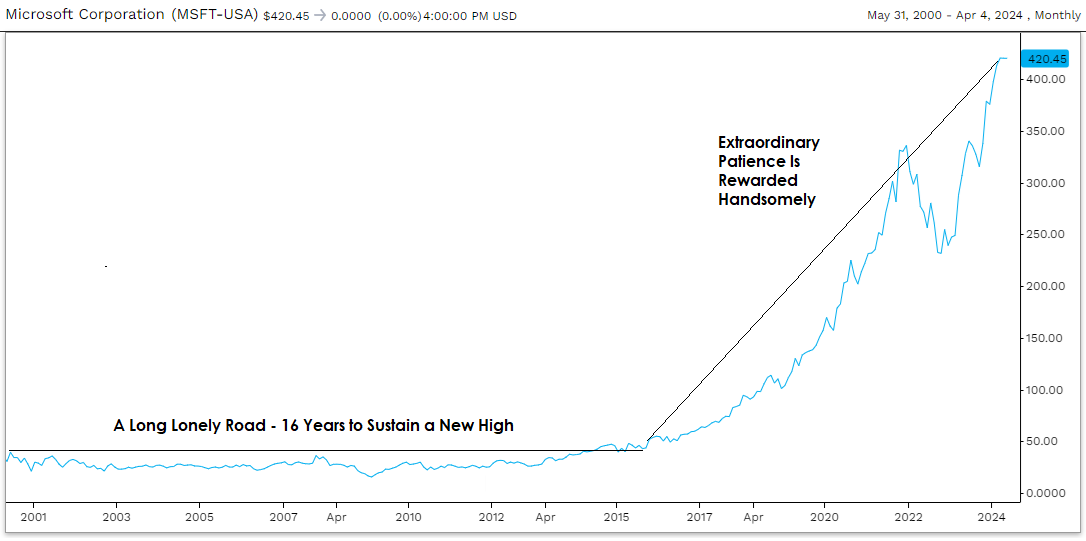
For example, Microsoft, a top performing stock throughout the 1990s, peaked in 2000 as part of the Dotcom bubble and didn’t sustain a new high until 2016 despite revenue growth of more than 350% over that 16 year period. Microsoft was one of the more fortunate stocks.
Microsoft Price Chart (Excluding Dividends) From January 1st, 2000 to April 4th, 2024
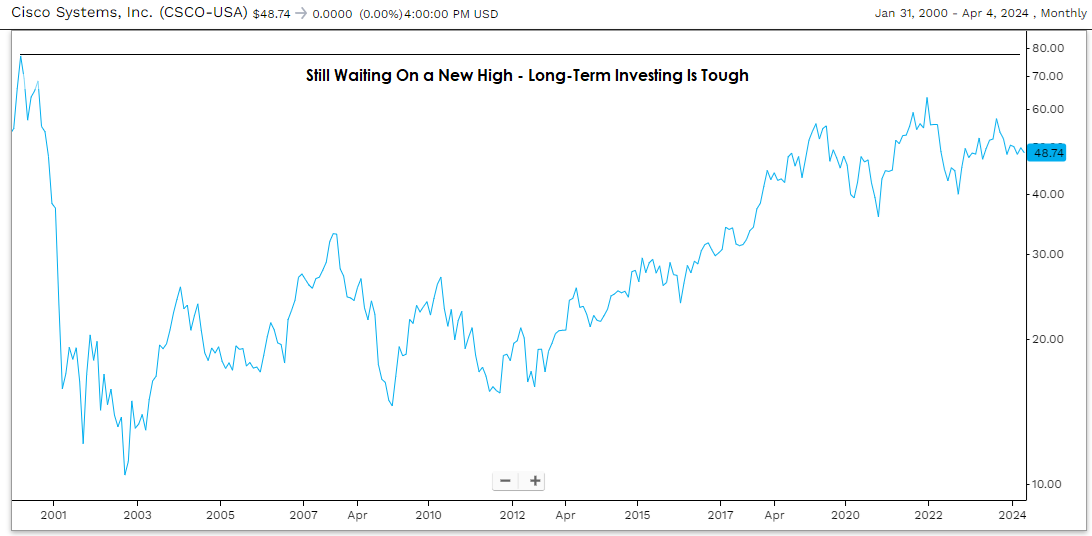
Cisco Systems, another Dotcom darling, peaked in 2000 and has not made a new high yet, despite revenue also growing more than 350% since then, though it has clawed its way back most of the way. As we know, there are numerous stocks that didn’t survive following the Dotcom crash – Pets.com, Webvan, Global Crossing – to name a few.
Cisco Systems Price Chart (Excluding Dividends) From January 1st, 2000 to April 4th, 2024
AI, like the internet, is expected to provide new avenues for economic growth and have significant productivity benefits, benefitting the well-being of humanity in general. That said, it often takes decades for the full effects of new innovations to play out. When each particular company/stock benefits from the boom also matters. Nvidia and Super Micro are benefitting from the boom now, but not many others are, and yet all “AI stocks” have appreciated in price nonetheless.
Although valuations may not help determine how a stock will perform in the next month or year, they help determine how a stock will perform over the very long-term, on average. Some stocks trading at high valuations will still generate strong long-term returns over very long periods but investors will often face sizable unrealized losses in the interim when buying stocks at high valuations. This will test investor resolve more than most investors appreciate. The cases of Microsoft and Cisco during the Dotcom bubble highlight the need to be very picky when “paying up” for stocks. If you’re buying bubbly stocks, buy the best but be prepared to possibly endure significant declines in future. So long as the stock’s story remains intact, you may be rewarded in the long-term.
AI Boom a Struggle for the US Federal Reserve and Other Central Banks
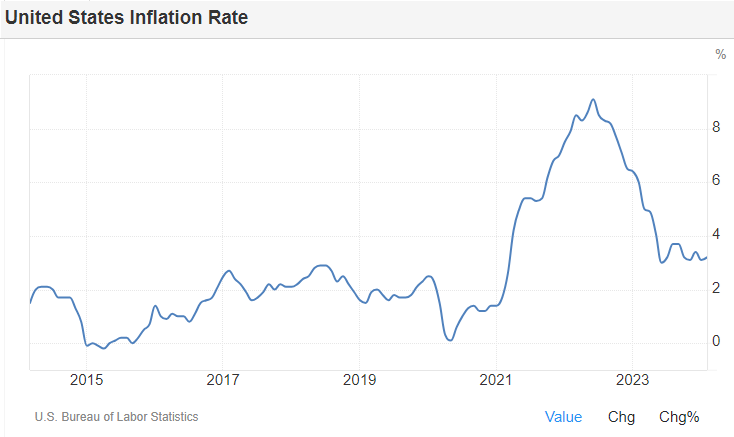
With respect to broader equity markets and the economy, speculation surrounding AI stocks and the boost to consumer and business confidence it generates isn’t helping central banks’ fight against inflation. Higher confidence and the wealth effect caused by higher asset prices theoretically leads to higher levels of spending in future, partly offsetting the effects of higher interest rates. Labour markets around the world also remain stubbornly strong, with unemployment rates still near historic lows and with job postings still elevated relative to the pre-COVID period, further making central banks’ task of taming inflation that much more difficult. We have seen the US inflation rate, as measured by the consumer price index (CPI) and the most global benchmark for inflation, flatline at close to 3%, well above the US Federal Reserve’s 2% inflation target. Sticky inflation may cause the US Federal Reserve, and some other central banks, to maintain interest rates at current levels to ensure inflation continues its descent, which could present challenges for debt heavy households and businesses.
How To Position Portfolios Going Forward?
Overall market valuations are elevated, largely due to very high valuations in the technology sector. Thankfully, high valuations only exist in pockets of the market and there are still many areas of the market with reasonable valuations. Many stocks outside of the technology sector are still trading near multi-year lows and at valuations that are below average, something we have highlighted in past commentaries.
Interest rate sensitive stocks in the telecom, utilities, consumer staples and real estate sectors look particularly attractive, especially if interest rates start to edge lower over time. Larger banks also appear to be inexpensive, pricing in a run-of-the-mill recession, something that is not guaranteed by any means. There are unique opportunities in equity markets as well, including fertilizer market leader Nutrien (NTR).
Nutrien is the #1 producer of potash and #3 producer of nitrogen in the world, making it integral to the global farming industry. Nutrien currently trades at ~6x EV/EBITDA, at the low end of its 5-year valuation range of 6x-12x, on earnings that reflect historically low fertilizer prices. We see Nutrien trending back toward the middle of its historical average valuation range over time and see high odds that fertilizer prices could spike again in future, as the Russia-Ukraine war and the Western response to the war evolves. At the very least, we see growing pressure for Western countries to pivot toward buying fertilizer from companies outside of Russia and Belarus (e.g. from Canada and the US) which could allow Nutrien to gain market share over time, something that has already occurred broadly in energy markets following the start of the war.
Emerging market equities led by China, and international equities in general, are trading at a historic discount to US equities. This is an area we have been intentionally underweight for quite some time, but the valuation gap between the US and the rest of the world has widened so much that we have added to this part of the markets recently and will continue to build a meaningful position over time.
Our preferred way to get passive exposure to emerging markets is the iShares Core MSCI Emerging Markets ETF (IEMG) and our preferred way to get passive exposure to international markets is the iShares Core MSCI Total International Stock ETF (IXUS). Maintaining actively managed exposure to international markets can be valuable given the wide country-by-country disparity in stock performance over time. Our preferred way to get active exposure to international markets is the GQG Partners International Quality Equity Fund (BIP791/794).
BIP791/794 provides active exposure primarily to international equity markets and at a relatively low management expense ratio (MER) of 1.10%. The managers of this fund have shown that they can deliver returns in line with international equity markets but with much lower volatility by being highly tactical both from a sector and country point-of-view. The fund ranks among the best International Equity funds in Canada, consistently being in the top 1% or 2%, depending on the period.
Preferred equities continued to rally strongly in Q1. The preferred equities we favour – those which recently saw their dividend reset and those with upcoming dividend resets – continued to rally far more than average as investors poured into these high yielding preferred shares. Some of these preferred shares are now approaching par ($25) which means that capital gains upside is now quite limited. We will look to capture profits in preferred shares as opportunities arise.
Fixed income and cash/HISAs (high interest savings accounts) continue to offer historically attractive and somewhat consistent returns, yielding 4%-5% on average. In addition to yield, traditional fixed income also offers the potential for price appreciation if/when interest rates start to come down. Certainty has rarely looked so good! The alternative investments we favour continue to offer expected returns in the high single digits and with low volatility. We will continue to maintain material exposure to fixed income and alternative investments with yields and prospective returns at these historically attractive levels to help increase certainty around long-term portfolio return expectations and minimize overall portfolio volatility.
While AI stocks are the talk of the town, we remain committed to structuring your portfolio for the long term with well diversified high-quality securities, including an allocation to alternative investments when possible. We are consistently reviewing the relative returns of each asset class and adjusting portfolios as opportunities arise.
If you ever have any questions or concerns about your portfolio or the investment markets in general, please feel free to reach out to us.
Sincerely,

Steele Wealth Management
The information contained in this report was obtained from sources believed to be reliable, however, we cannot present that it is accurate or complete. Information has been sourced from the RJL Bond Desk or RJ Private Client Solutions, unless otherwise noted. Index and sector returns represented in this commentary are measured using the S&P/TSX Total Return Index and S&P/TSX GICS Sector Indices as detailed in Raymond James Ltd.’s Insights & Strategies: Quarterly Edition. This report is provided as a general source of information and should not be considered personal investment advice or solicitation to buy or sell securities. The views expressed are those of the author and not necessarily those of Raymond James Ltd. (Member Canadian Investor Protection Fund).
This Quarterly Market Comment has been prepared by Steele Wealth Management and expresses the opinions of the author and not necessarily those of Raymond James Ltd. (RJL). Statistics and factual data and other information are from sources RJL believes to be reliable but their accuracy cannot be guaranteed. The performance outlined in the report is net of fees. The client account performance may vary from the model portfolio due to several factors, including the timing of contributions and dates invested in model. The performance reported is that of the account that represents the model, not a composite. Performance calculation for the models may be different than the index used as a reference point. It is for information purposes only and is not to be construed as an offer or solicitation for the sale or purchase of securities. This Quarterly Market Comment is intended for distribution only in those jurisdictions where RJL and the author are registered. Securities-related products and services are offered through Raymond James Ltd.
Commissions, trailing commissions, management fees and expenses all may be associated with mutual fund investments. Please read the prospectus before investing. Mutual funds are not guaranteed, their values change frequently and past performance may not be repeated.


![]()
